There is relief on the way — vaccines have been developed and are being distributed, and maybe the world returns to normalcy in mid-2021.
It is almost a year since the virus first appeared outside of China. There have been several false alarms about the end of the virus; it is still ongoing, and in most parts of the world, the second leg of the virus (post July 2020), has been worse than the first. There is relief on the way — vaccines have been developed and are being distributed, and maybe the world returns to normalcy in mid-2021.
Economists (and policymakers) like natural experiments and plenty have been on offer. For the first time in world history, countries went into lockdowns as a deliberate strategy to counter the virus. The strategy emerged from the very place from where the virus first appeared — Wuhan, China. As many countries closed shop, the spread of the virus was arrested, but only temporarily, as it now appears.
A study of the evolution of the virus suggests the following sets of conclusions. First, like Joan Robinson said in another context, for everything that can be said about the virus, the opposite is also true. Lockdowns work — and they don’t. If they worked was the conventional conclusion (and there are many who still believe that lockdowns are “efficient” in controlling infections) then how does one explain the intensity and magnitude of the spread post the lockdown? What ex-ante theory of lockdowns expected/stated/believed that post the lockdown, there would be many cases, let alone that the cases would be far higher than during lockdowns?
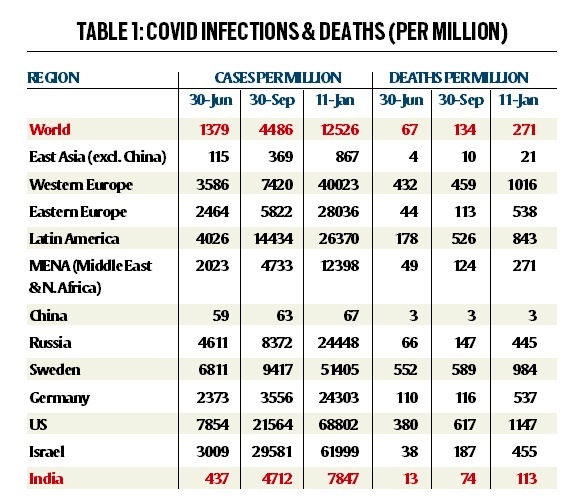
But what one can explain is the answer of the faithful. The answer is simple and straightforward — the lockdowns were lifted too early, the infection had not died out, and hence the explosion in cases (and deaths). There will be time to analyse this proposition in some detail — but, for the moment, this defence is as close to circular reasoning as you can get. By this “logic”, if the virus did not re-emerge (as in New Zealand, Taiwan, or Thailand), the timing of lockdown-lift was perfect. If it did re-emerge (as in most of Western Europe and the US — see table), then “obviously” it is the case that the lockdown-lift came too early.
The data does yield (ex-post) some non-nihilist conclusions. There is a common pattern to the success stories. Some of them employed a lockdown — but all the success stories involved a version of the 3-T policy. Testing, Tracing and Treatment. The 3-Ts policy is based on governments ramping up testing capabilities to identify those that are COVID–19 positive and isolating them to prevent the spread of the disease; next, tracing everyone who came in contact with those who had tested positive; testing the contacts; and then treating those that tested positive using different clinical protocols.
That lockdown is not a necessary condition for victory is emphatically supported by the fact that more than a 100 countries practised lockdowns at one time or another, and less than a dozen succeeded. But all countries that did succeed also practised ancient wisdom as embedded in the 3-T policy. This fact deserves emphasis. The world has endured many viruses, many contagions. Check your history books — no region/country practised a lockdown prior to 2020. Should one believe, therefore, that all other viruses were less contagious? The US strategy of confronting the 1957-58 flu is discussed in Lockdowns and Closures vs COVID–19: COVID Wins (available at http://ssbhalla.org/wp-content/uploads/2020/10/Lockdowns-Closures-vs.-COVID19-Covid-Wins-Nov-4.pdf) and should be required reading for lockdown and other experts. The US had a version of the common flu much worse than any experienced before, or since. Yet the US authorities, under the able leadership of D A Henderson, faced the flu without lockdowns. What was the strategy employed? The same as that practised with all infectious diseases for centuries — attempt to isolate, and social distance from the patient. In the 1957-58 flu, some schools were closed, others remained open; ditto with workplaces; but emphatically no lockdown. The 3-T is a modern version of the same.
The table reports the data on COVID infections and deaths for several regions of the world (and selected countries). The data are presented for three dates — end-June, end-September, and January 11, 2021. The reader can peruse the comparisons at leisure, but we will discuss the India pattern in September and now. End September was the time when there was great worry; experts and the media were obsessed with India’s bad virus “performance”, and theories were developed as to how India could not do much right. No one (or very few) were predicting what actually transpired. End September, the Indian average (cases per million) was 4,712 — almost identical to the world average (4,486) and the average of Middle East and North Africa (MENA). As of January 11, MENA and the world are close together (12,398 and 12,526), but India is one-third lower.
The deaths per million evolution is like cases, but there is a noticeable difference. Deaths are considerably lower in India — only 113 per million versus 271 per million for the world and 274 for MENA. Note the very low value of deaths in sub-Saharan Africa and in East Asia. Two broad conclusions follow, but also need a follow-up. First, poorer countries seem to have been affected less adversely than the richer, more advanced economies. One suggested explanation (possibility) is that poorer countries have had to live longer with diseases (and bad sanitation) and, therefore, have developed some immunity which make them less prone to infections, ceteris paribus. Second, East Asia has a very low incidence of COVID-19, even after excluding China. One possible explanation is that this region has had greater experience with flu (for example, the avian flu).
One additional note about the continuing march towards herd immunity in India. In a paper presented at IRADE in December, we made a forecast of the “end” of COVID in India — we had said 12 million infections and the end sometime in April. Our forecast for India as of today — 10.5 million infections and the end sometime in May-June. Based on the available state-level data, some states in India have already achieved herd immunity while other states are catching up. States like Andhra Pradesh, Assam, Bihar, Jammu and Kashmir, Jharkhand and Goa have seen flattening; others like Karnataka, Maharashtra, are catching up.
One final note: Can we infer from these data that India might be approaching herd immunity, and doing so before vaccines are widely available? The many East Asian economies that have succeeded (for example, Vietnam, Taiwan, Cambodia, Laos, China etc.) did so by controlling infections at an early stage, that is, infections were never large enough to warrant a relationship with herd immunity. Ditto the case with regions in sub-Saharan Africa. Only India stands out with a flattening curve among those that had earlier experienced an explosion of infections. The extraordinary decline of COVID-19 cases (and deaths) in India is an issue, like lockdowns, deserving of a more detailed study.
Bhalla is Executive Director IMF representing India, Sri Lanka, Bangladesh and Bhutan. Bhasin is a New Delhi based policy researcher. The views expressed are those of the authors and do not necessarily represent the views of the IMF, its Executive Board, or IMF management
Source: Read Full Article


