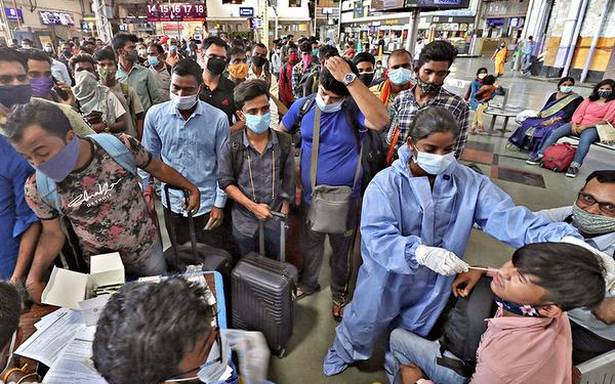
The sharp spike in cases can be attributed to the higher testing levels in the second wave compared to the first
The second wave of COVID-19 cases in India and especially Maharashtra appears to be quicker than the first wave. However, the sharper spike can be attributed to the higher testing levels in the second wave compared to the first. In the graphs, days taken for a select number of cases in the second wave are compared with the days taken for a similar number of cases in the first wave. The number of COVID-19 tests conducted during the two time periods was also analysed.
Cases in India
The graph shows the seven-day average number of cases in India. During the second wave, cases increased from 11,107 (Feb. 15, 2021) to 37,223 (March 21, 2021) in just 35 days. A similar increase during the first wave took 37 days (June 16, 2020 to July 22, 2020).
Chart appears incomplete? Click to remove AMP mode
Tests in India
The graph shows the seven-day avg. number of daily tests conducted in India. During the second wave, between Feb. 15, 2021 and Mar. 21, 2021, India conducted 7,92,261 daily tests on an average. It conducted only 2,47,414 daily tests between June 16 and July 22, 2020.
Cases in Maharashtra
The graph shows the seven-day average number of cases in Maharashtra. During the second wave, cases increased from 2,415 (Feb. 11, 2021) to 23,610 (Mar. 21, 2021) in over 39 days. A similar increase during the first wave took 117 days (May 24 to Sept. 17, 2020).
Tests in Maharashtra
The graph shows the seven-day avg. no. of daily tests conducted in Maharashtra. During the second wave, between Feb. 11 and Mar. 21, 2021, Maharashtra conducted 83,271 daily tests. It conducted only 45,310 daily tests between May 24 and Sept. 17, 2020.
Note: All data are upto March 21
Source: covid19india.org
Source: Read Full Article

